NO2 measurements
Nitrogen dioxide (NO2) measurements were performed using passive diffusion tubes from the Swiss laboratory Passam ag (Schellenstrasse 44, 8708 Männedorf, Switzerland), accredited according to ISO/IEC 17025 (International Organization for Standardization, 2017). The tube is made of polypropylene and contains the absorbent triethanolamine, into which NO2 diffuses, after which it is extracted under laboratory conditions and measured quantitatively. The tubes were stored in accordance with laboratory requirements—tightly sealed in an envelope, in the dark, avoiding overheating. Monthly samples were taken at each of the pre-selected measurement points using a pair of diffusion tubes (to avoid distortion of the results from single defective tubes) and were periodically sent by courier to the laboratory for analysis with a spectrophotometer SP01, Salzmann, in accordance with EN 13528 (European Committee for Standardization, 2002) and EN 16339 (European Committee for Standardization, 2025). For the purposes of the calculations, meteorological data – average monthly humidity, temperature, and atmospheric pressure – were provided to the laboratory from the automatic air quality monitoring stations in Plovdiv, operated by the Ministry of Environment and Water/Executive Environment Agency.
Before starting the fieldwork, potential sampling sites were first inspected remotely using Google Street View (Google, n.d.), and then visited on site by a member of the research team to determine whether they were suitable for conducting measurements. The assessment took into account the availability of a vertical structure on which to mount the tubes according to the set criteria, the absence of construction or repair work, and the likelihood of the tubes being removed by third parties (e.g., if they were mounted too low and close to a school building). During the actual installation of the tubes, several changes were made due to technical obstacles that arose in individual cases.
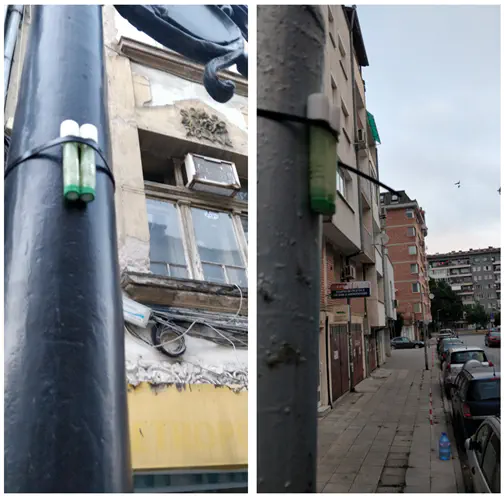
The measurements were taken on a monthly basis over a six-month period, as follows: July 6, 2023 – August 5, 2023, August 5, 2023 – September 3, 2023, September 3, 2023 – October 4, 2023, 04.10.2023 – 03.11.2023, 03.11.2023 – 04.12.2023, and 04.12.2023 – 04.01.2024. The installation and removal of the pipes was synchronized within a 24-hour period each month. They were not placed directly on the facades of buildings, but on traffic sign posts, street lamps, and other structures at a height (~2.6 m), at a distance from the road and intersections. These poles were selected so that they are close to the facades of the buildings without the air movement being affected by the aerodynamic shadow of the latter.
The measurements were taken at 40 points. Given the resources available at the time, monthly measurements were taken at 26 points, while the remaining 14 were divided into two groups of seven, with measurements taken once a month for each group. Forty measurement points for a city the size of Plovdiv can be considered sufficient to account for spatial variations in NO2, allowing for the subsequent creation of a model. The determination of the optimal location for measurements largely followed the guidelines of previous projects, but took into account the urban fabric of Plovdiv and the technical capabilities of the team – to be located away from intersections, to cover points along roads of different classes according to expected traffic intensity, to have points near the air quality monitoring stations of the Ministry of Environment and Water/Executive Environment Agency for the purpose of calibrating the measurements, to have points on open-type roads and street canyons. NO2 measurement points were added, selected by intersecting urban spatial characteristics – traffic volume, urban street canyon profiles (closed and semi-open), altitude and the presence or absence of riverine areas in the vicinity, considering their microclimatic influence.
The missing values for some months were filled in using the multiple imputation method, which generates replacement values for the missing ones by calculating them based on the correlations between the remaining values, repeating the procedure ten times and taking the average value. The correlation between the initial and imputed mean values for each location was high (r = 0.94).