
Normalized Difference Vegetation Index
Normalized Difference Vegetation Index (NDVI)
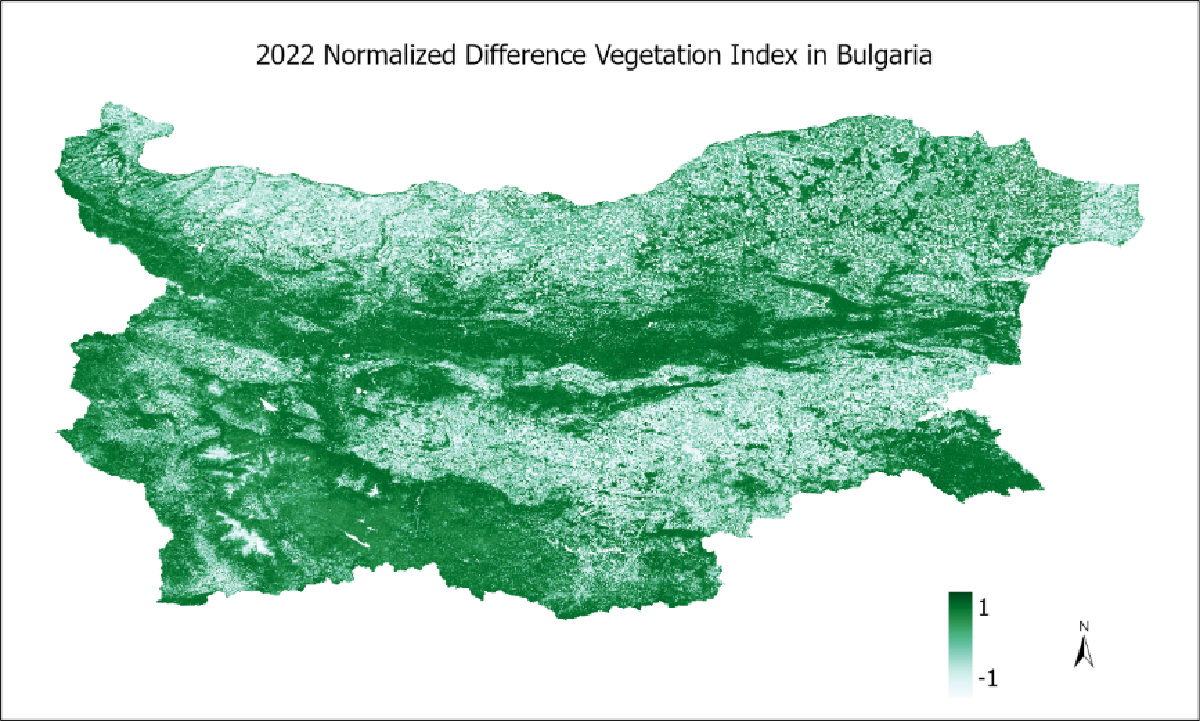
NDVI is the gold-standard to capture greenness (biomass). It measures the chlorophyll content in the vegetation canopy. The index is computed as follows: NDVI = ((NIR - Red) / (NIR + Red)), whereas NIR refers to the pixel values from the near-infrared band and Red refers to pixel values from the red band. The NDVI values range between -1.0 and 1.0. Negative values refer to non-biomass (e.g., water, and snow) and values around 0 represent rocks and bare soil. The higher the positive values, the higher the amounts of biomass.
Data Processing
The exposure maps were derived from the Sentinel-2 imagery from Copernicus. The exposures are available in World Geodetic System 1984 (WGS84). The data in WGS84 coordinate system (EPSG 4326) can be reprojected in the local Bulgarian coordinate system using the EPSG code 7801. The exposure maps are for the year 2022.
Before computing the multispectral index, we selected remote sensing images within a specific period. We used only those scenes captured between May and September 2022 when vegetation is greenest.
Before determining these multispectral images, we only considered those Sentinel-2 scenes fulfilling some cloudiness criteria. First, we excluded Sentinel-2 images with a cloud cover of more than 10%. Second, we made a pixel-based quality check to filter out poor-quality surface reflectance values using cloud mask and quality assessment band (QA60) information (see appendix of Chen et al. 2022). Finally, we computed the multispectral index based on the valid scene and we took the median pixel values across overlapping scenes and merged them into a single raster layer. The spatial resolution was 10 m.
Epidemiology Example
- Dzhambov AM, Dimitrova D, Burov A, Helbich M, Markevych I, Nieuwenhuijsen MJ. Physical urban environment and cardiometabolic diseases in the five largest Bulgarian cities. Int J Hyg Environ Health. 2025;264:114512. doi: 10.1016/j.ijheh.2024.114512.
References
Tucker, C. J. (1979). Red and photographic infrared linear combinations for monitoring vegetation. Remote sensing of Environment, 8(2), 127-150.
Bannari, A., Morin, D., Bonn, F., & Huete, A. (1995). A review of vegetation indices. Remote sensing reviews, 13(1-2), 95-120.
Chen, B., Tu, Y., Wu, S., Song, Y., Jin, Y., Webster, C., … & Gong, P. (2022). Beyond green environments: Multi-scale difference in human exposure to greenspace in China. Environment International, 166, 107348.